New portfolio holding detail
Complex holding information
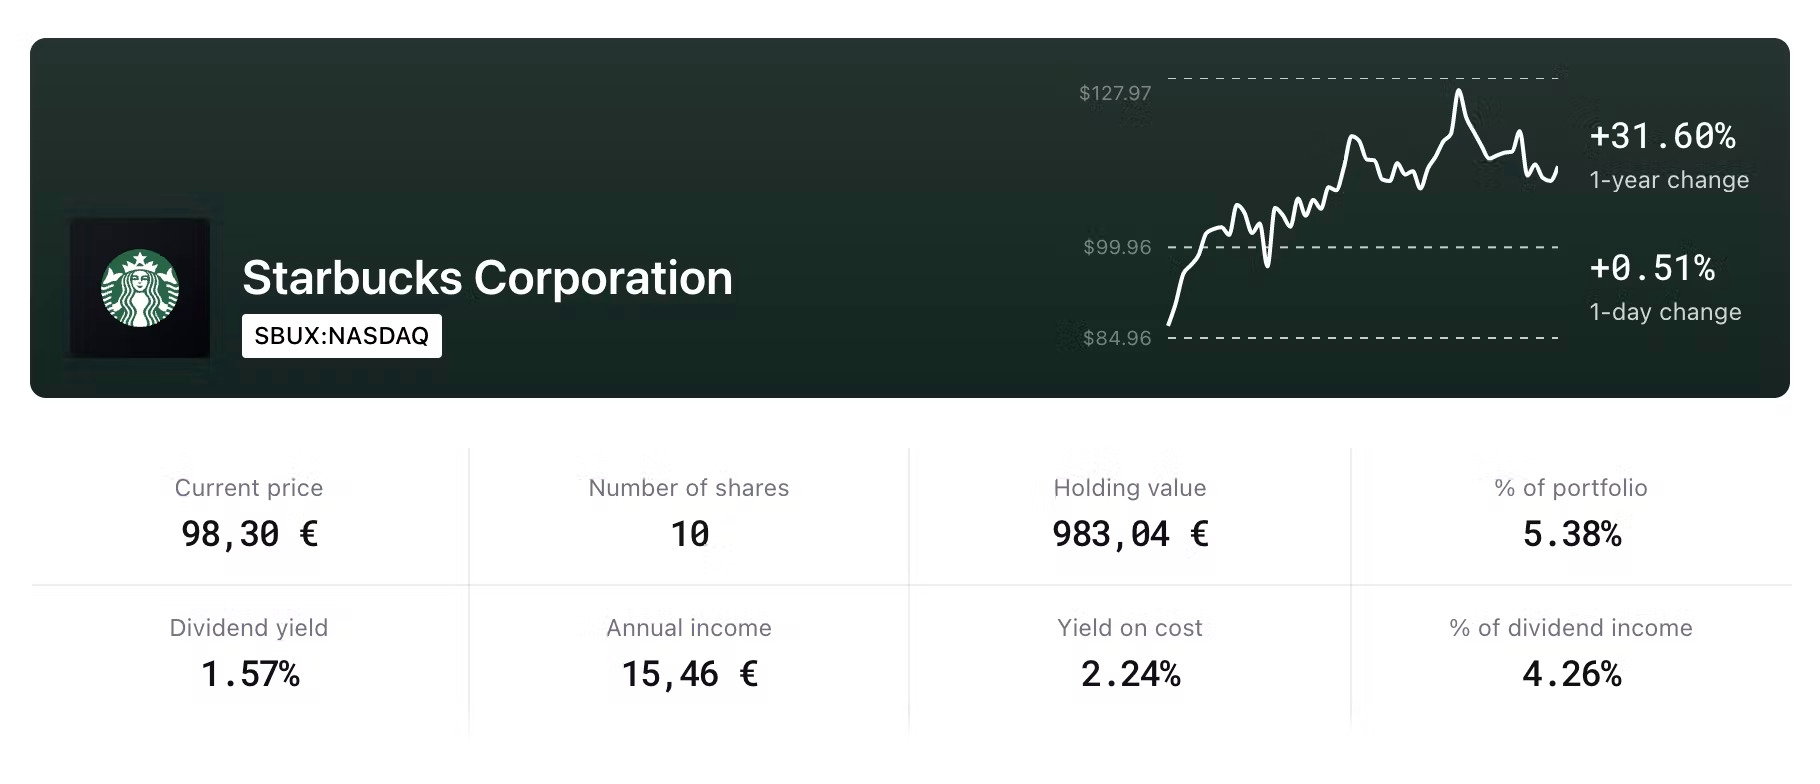
With this redesign, every holding detail is now themed in company logo colors. On the top, you will find a new chart which shows price changes for last year and last trading day.
With a simple look, you can also see all the calculated information about your holding. We added two more new statistics:
% of portfolio – how much percent of your portfolio is allocated in the stock
% of dividend income – if the stock is dividend payer this will show how much of your annual income comes from this specific holding
These two percentage numbers can give you an even better insight into your investing strategy. This is of course re-calculated every trading day and every dividend announcement.
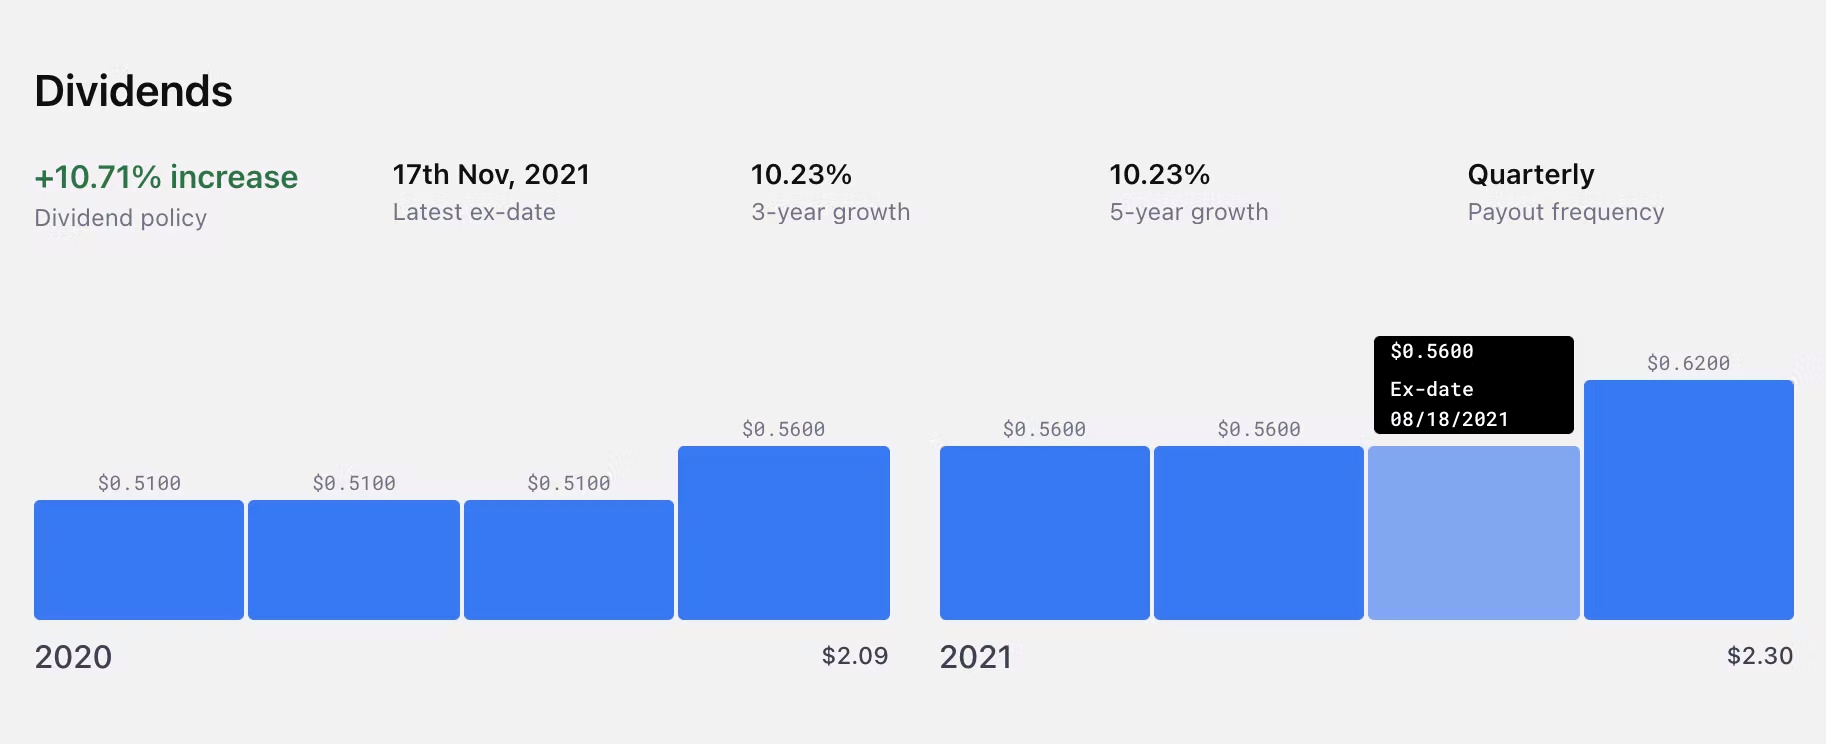
Check dividend data with one glance
Whole new section with dividend information showing average growth for last 3 and 5 years as well as payout frequency.
If our algorithms are able to calculate stock dividend policy we also show this information with simple "Dividend policy" field. This field show decrease, increase or no change in dividends paid out by company.
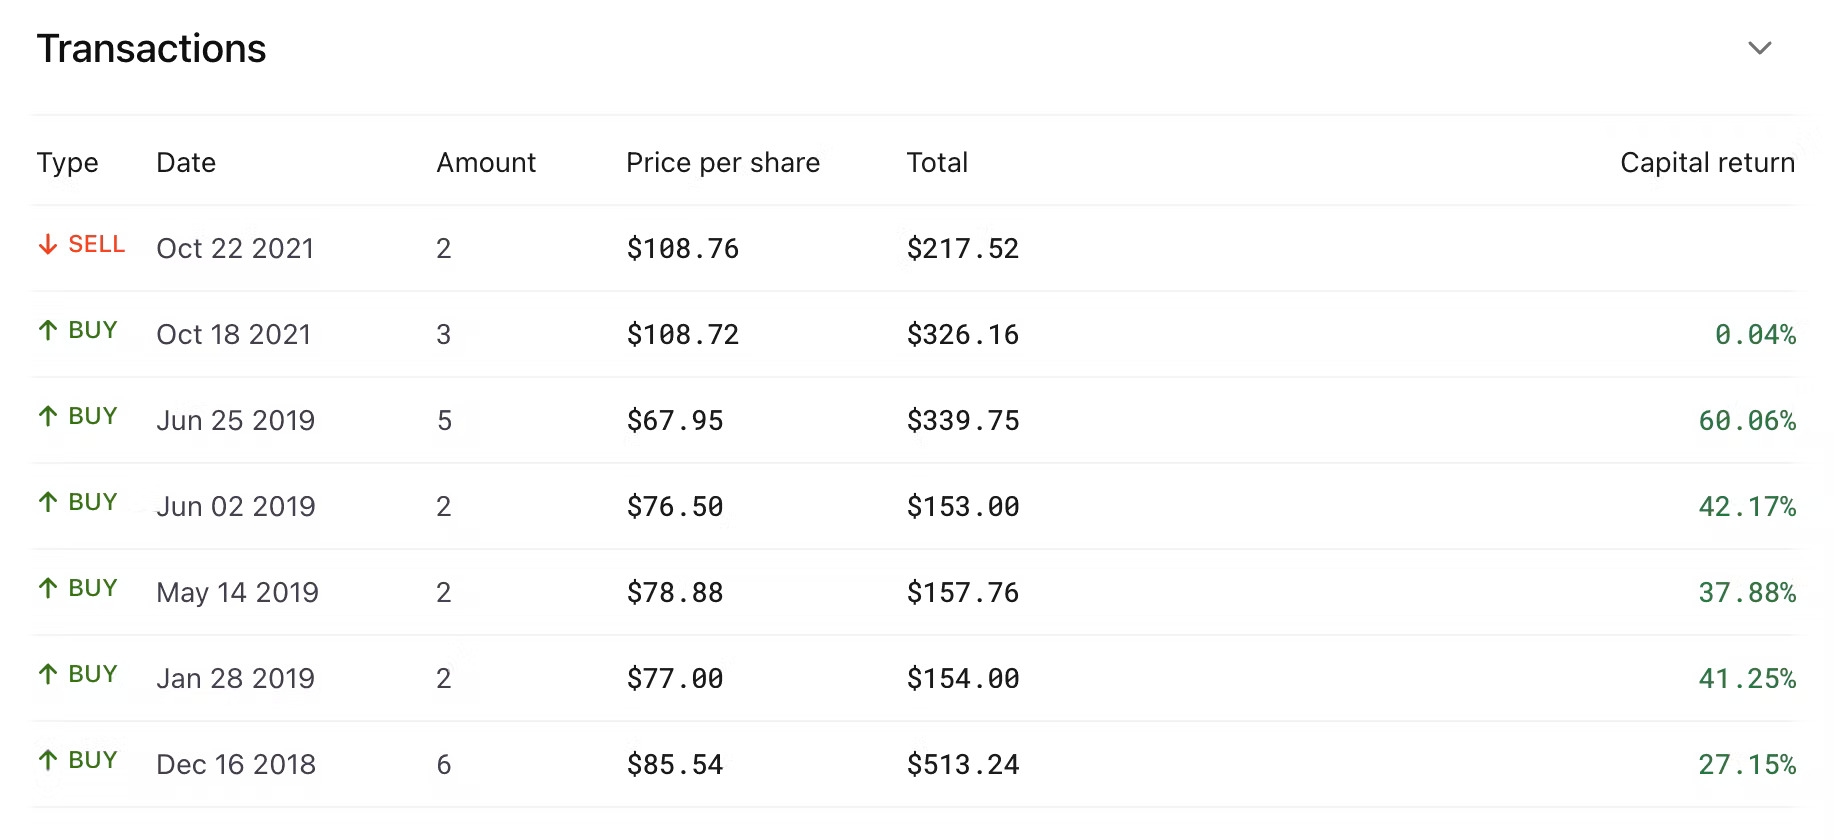
Dollar cost averaging never been easier
We also improved the transactions section which now shows the type of transaction.
With every BUY transaction, you can see a capital gain or loss calculated exactly for the specific transaction.
Check these new improvements in your portfolio!


