Sign in
PXJ Stock Price, Chart, Stats & News


Invesco Oil & Gas Services ETF
Save
Equity Energy
Category
2.29%
Dividend yield
$0.9417
0.67%
Expense ratio
135.19M
Assets
77.82%
1Y return
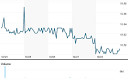
PXJ chart
1M
3M
1Y
5Y
Loading chart...
PXJ returns
| YTD | 50.84% |
| 1Y | 77.82% |
| 3Y | 26.71% |
| 5Y | 18.72% |
| 10Y | -1.16% |
| 1Y volatility | 28.43% |
| 3Y volatility | 28.33% |
| Sharpe ratio | 0.85 |
About
The Invesco Oil & Gas Services ETF (PXJ) is an investment fund designed to mirror the performance of the Dynamic Oil Services Intellidex Index (the Index). Ordinarily, the ETF allocates a minimum of 90% of its total assets to the common equity securities that constitute this underlying index. The Index employs a rigorous methodology to select its constituents, evaluating companies based on a diverse set of investment merits, such as price momentum, earnings momentum, quality, management effectiveness, and valuation.
Top 10 PXJ holdings
| Holding | Ownership |
|---|---|
Energy 5.48% | |
Energy 5.15% | |
Energy 5.08% | |
Energy 4.94% | |
Energy 4.85% | |
Energy 4.81% | |
Energy 4.78% | |
Energy 4.77% | |
Energy 2.90% | |
Energy 2.83% |


Similar securities
Based on sector and market capitalization


Report issue