


Dividend Growth Rate: What It Is, Formula, and Why It Matters
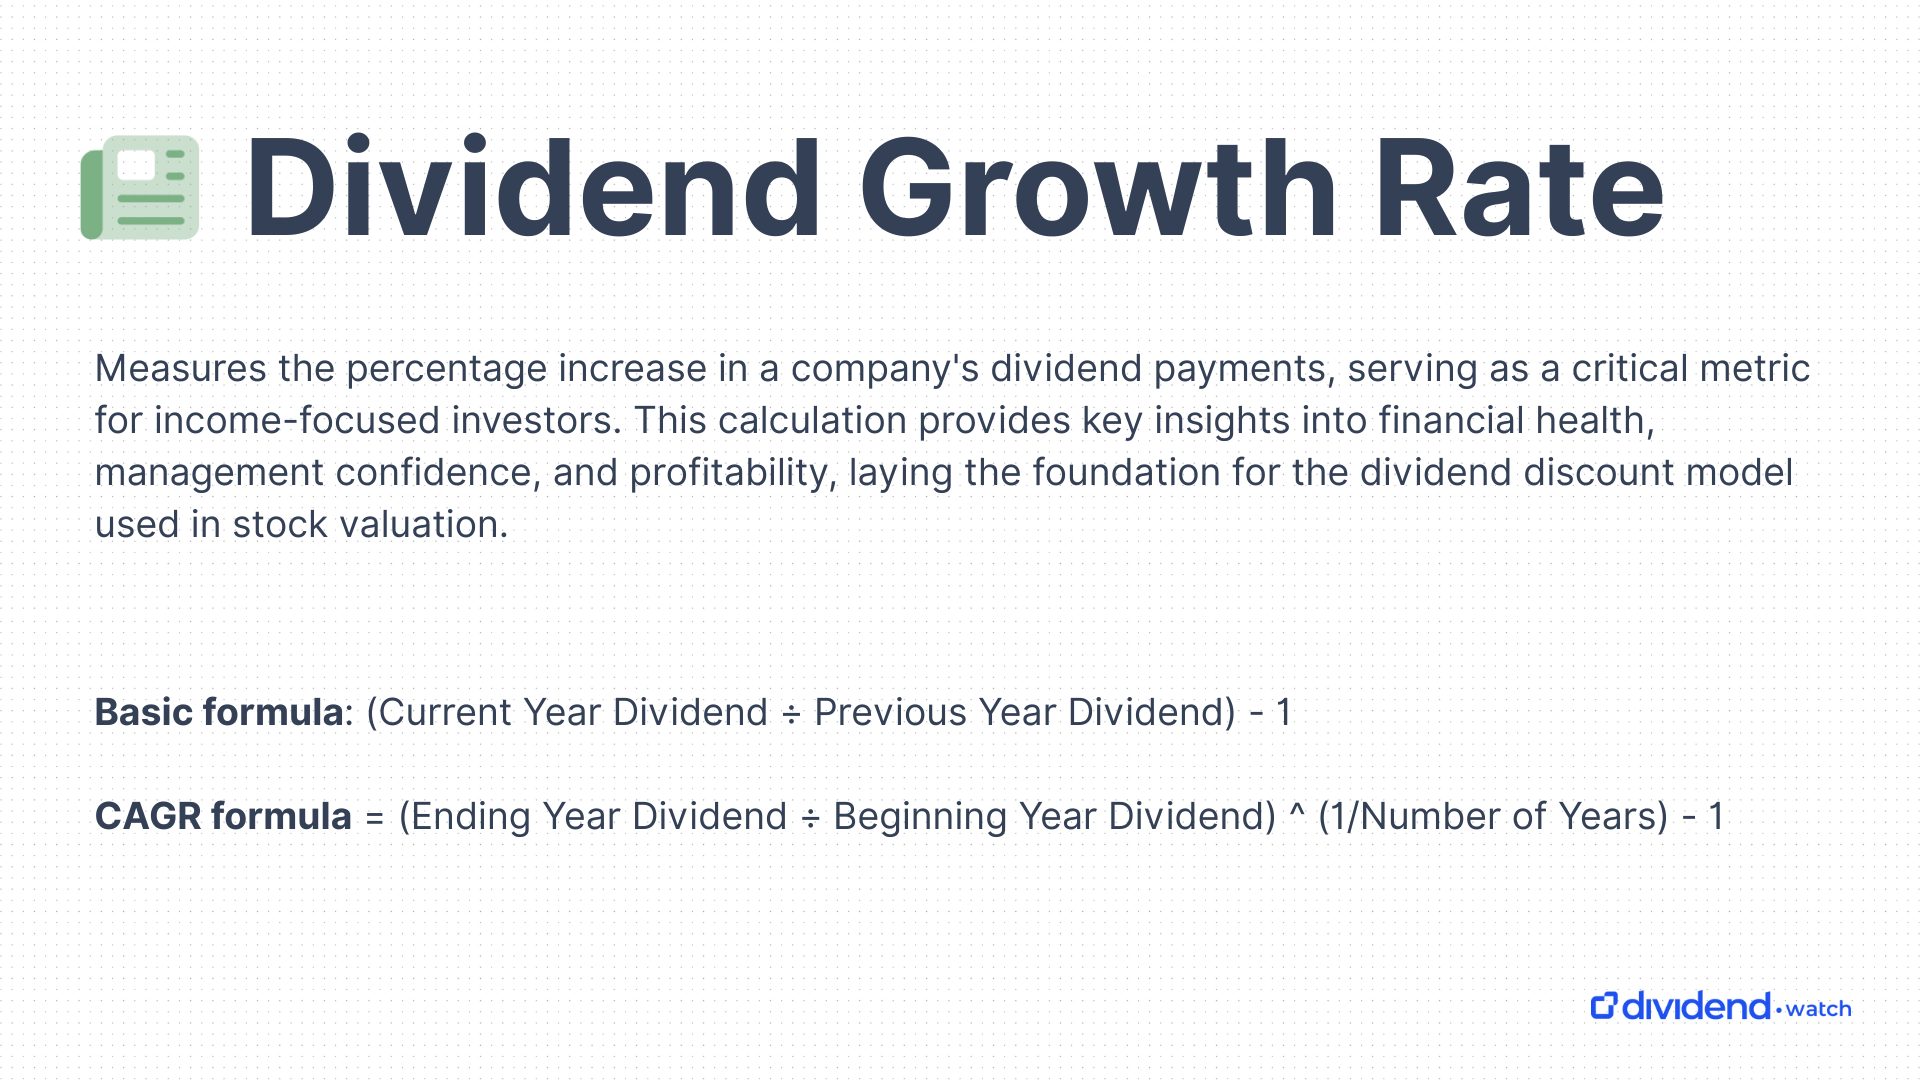
The dividend growth rate measures the annualized percentage increase in a company's dividend payments, serving as a critical metric for income-focused investors. This calculation provides key insights into financial health, capital allocation strategy, and profitability, laying the foundation for the dividend discount model used in stock valuation.
Let’s break down exactly how to calculate the dividend growth rate, why it matters, and how to use it to find the best dividend stocks.
Dividend Growth Rate Formula: Example Calculation
The simplest dividend growth rate equation follows a straightforward approach that compares dividend payments across different periods. The basic year-over-year formula is:
Simple Dividend Growth Rate = (Current Year Dividend ÷ Previous Year Dividend) - 1
To illustrate this calculation, let's examine The Coca-Cola Company (KO), a renowned Dividend Aristocrat with decades of consecutive dividend increases. Here's Coca-Cola’s recent dividend history and associated growth rates:
| Year | Annual Dividend | Dividend Growth Rate |
|---|---|---|
| 2021 | $1.68 | - |
| 2022 | $1.76 | 4.8% |
| 2023 | $1.84 | 4.5% |
| 2024 | $1.94 | 5.4% |
For a clearer picture of a company’s dividend trajectory, investors often turn to the compound annual growth rate (CAGR). Unlike year-to-year changes that can be noisy, CAGR smooths out the bumps and offers a more dependable baseline for forecasting future growth.
Dividend CAGR = (Ending Year Dividend Beginning Year Dividend) ^ (1/Number of Years) - 1
Take Coca-Cola, for example. Its 3-year dividend CAGR from 2021 to 2024 compounds at a steady 4.9%.
Dividend CAGR = ($1.94 ÷ $1.68) ^ (1/3) - 1 = 4.9%
Why is the Dividend Growth Rate Important?
Consistent dividend increases are more than just a feel-good stat. They’re proof that a company can generate real, reliable cash flow through all kinds of market weather. Since dividends reflect actual cash in investors’ pockets, rising payouts offer a tangible sign of long-term value creation.
Dividend growth rates also spotlight how management prioritizes capital, striking a balance between rewarding shareholders and fueling future growth. That’s why this metric is key for evaluating dividend growth stocks, like Dividend Kings, which are prized by income investors for their rock-solid, rising payouts.
Companies with strong dividend growth histories also tend to share a few traits: steady cash flow, competitive strength, and financial discipline. The result? Lower volatility, more stability, and returns with less risk than high-flying growth stocks.
Using the Dividend Growth Rate to Value Stocks
The dividend discount model (DDM) represents the most direct application of dividend growth analysis for stock valuation. This model assumes that a stock's intrinsic value equals the present value of all future dividend payments, making the metric a crucial input for determining fair value.
The Gordon Growth Model, the most commonly used version of the DDM, follows this formula:
Gordon Growth Model = D₁ ÷ (r - g)
- D₁ = Next year's expected dividend per share
- r = Cost of equity
- g = Expected dividend growth rate
Let's apply this model to value Coca-Cola shares. Assuming the company’s dividend continues to grow at historical rates, the annual dividend is expected to be $2.04. The stock valuation would be calculated as below using a 9% cost of equity:
Coca-Cola Stock Value = $2.04 ÷ (0.09 - 0.049) = $2.04 ÷ 0.041 = $49.76
This estimated value gives investors a benchmark. If Coca-Cola’s current share price is below the result, the model suggests the stock could be undervalued based on its dividend growth outlook.
Growth Rate Calculation Methods
There are several methods for calculating dividend growth, each with its own approach. However, CAGR is the gold standard that smooths out year-to-year fluctuations and offers the clearest view for comparing growth across companies and timeframes. That’s why you’ll see it used most often by analysts and financial sites.
Compound Annual Growth Rate (CAGR)
CAGR offers a more accurate representation by calculating the annualized growth rate over multiple periods. Most professional investors prefer CAGR when discussing dividend growth rates because it better reflects the actual compounding effect experienced by long-term investors.
Sustainable Growth Rate
A stock's sustainable dividend growth rate is the maximum rate at which a company can increase its dividend payments over time without compromising its financial health or requiring external financing.
Sustainable Growth Rate = Return on Equity × (1 - Dividend Payout Ratio)
Arithmetic Average
The arithmetic average calculates the simple average of year-over-year growth rates over a specific period. This approach provides equal weight to each year's growth rate but doesn't account for compounding effects.
Sector Dividend Growth Rate Benchmarks
Different sectors exhibit varying dividend growth patterns based on their business models, capital requirements, and competitive dynamics. We’ve provided below a brief overview of ballpark healthy growth ranges for the market’s sectors.
- Communication Services (0%-6% annually): Traditional telecom companies offer modest but stable growth, while newer media and internet companies may have more volatile dividend policies.
- Consumer Discretionary (0%-10% annually): In this highly cyclical sector with wide variations, some companies suspend dividends during downturns, while others in stable niches maintain steady mid-single-digit growth.
- Consumer Staples (3%-7% annually): Companies in the food, beverage, and household product sectors benefit from stable demand patterns and strong brand recognition, enabling consistent cash flow generation and reliable dividend growth.
- Energy (highly variable): The energy sector is extremely volatile and variable, although established players can generate mid-to-high single-digit growth rates.
- Financials (3%-8% annually): Banks and insurance companies typically maintain conservative dividend policies due to regulatory capital requirements, though growth can accelerate during favorable interest rate environments.
- Healthcare (4%-8% annually): Big pharma and medical device manufacturers benefit from patent protection and demographic trends that can generate high growth rates.
- Industrials (3%-7% annually): Manufacturing and infrastructure companies typically offer steady dividend growth that aligns with economic expansion, although cyclical exposure introduces some volatility.
- Materials (2%-8% annually): Chemical and mining companies typically offer moderate dividend growth that correlates with commodity cycles and global economic demand.
- Real estate/REITs (2%-6% annually): These companies tend to focus on high current yields rather than aggressive dividend growth.
- Technology (highly variable): The tech sector features some rare, established dividend payers with high initial growth rates of 10% or more annually, while others adopt more conservative approaches that funnel profits into revenue growth rather than issuing dividends to shareholders.
- Utilities (2%-5% annually): Companies in the sector benefit from regulated business models and predictable cash flows but face significant capital investment requirements that limit aggressive dividend growth.
Related Metrics
Dividend stock analysis becomes most effective when combining the dividend growth rate with other dividend-related metrics. The supporting figures detailed below provide context, uncover hidden risks, and highlight opportunities that raw growth rates may overlook.
Dividend Payout Ratio
The dividend payout ratio measures the percentage of a company's earnings that is paid out as dividends. Companies with low payout ratios (below 60%) have more flexibility to grow their dividends at higher rates, while companies with high ratios (above 80%) may face constraints during challenging periods.
Dividend Yield
The dividend yield can exhibit an inverse relationship to dividend growth rates. Companies with high current yields may have limited growth potential, while companies with lower yields might offer superior growth prospects.
Free Cash Flow Payout Ratio
The ratio of dividends per share to free cash flow per share reveals a company's ability to fund dividends without external financing, providing insights into dividend sustainability. This figure is an iteration of the dividend payout ratio, which uses earnings per share instead.
How to Find Dividend Growth Rates
Dividend Watch’s portfolio tracker automates calculating dividend growth rates for stocks in your portfolio and on your watchlists.
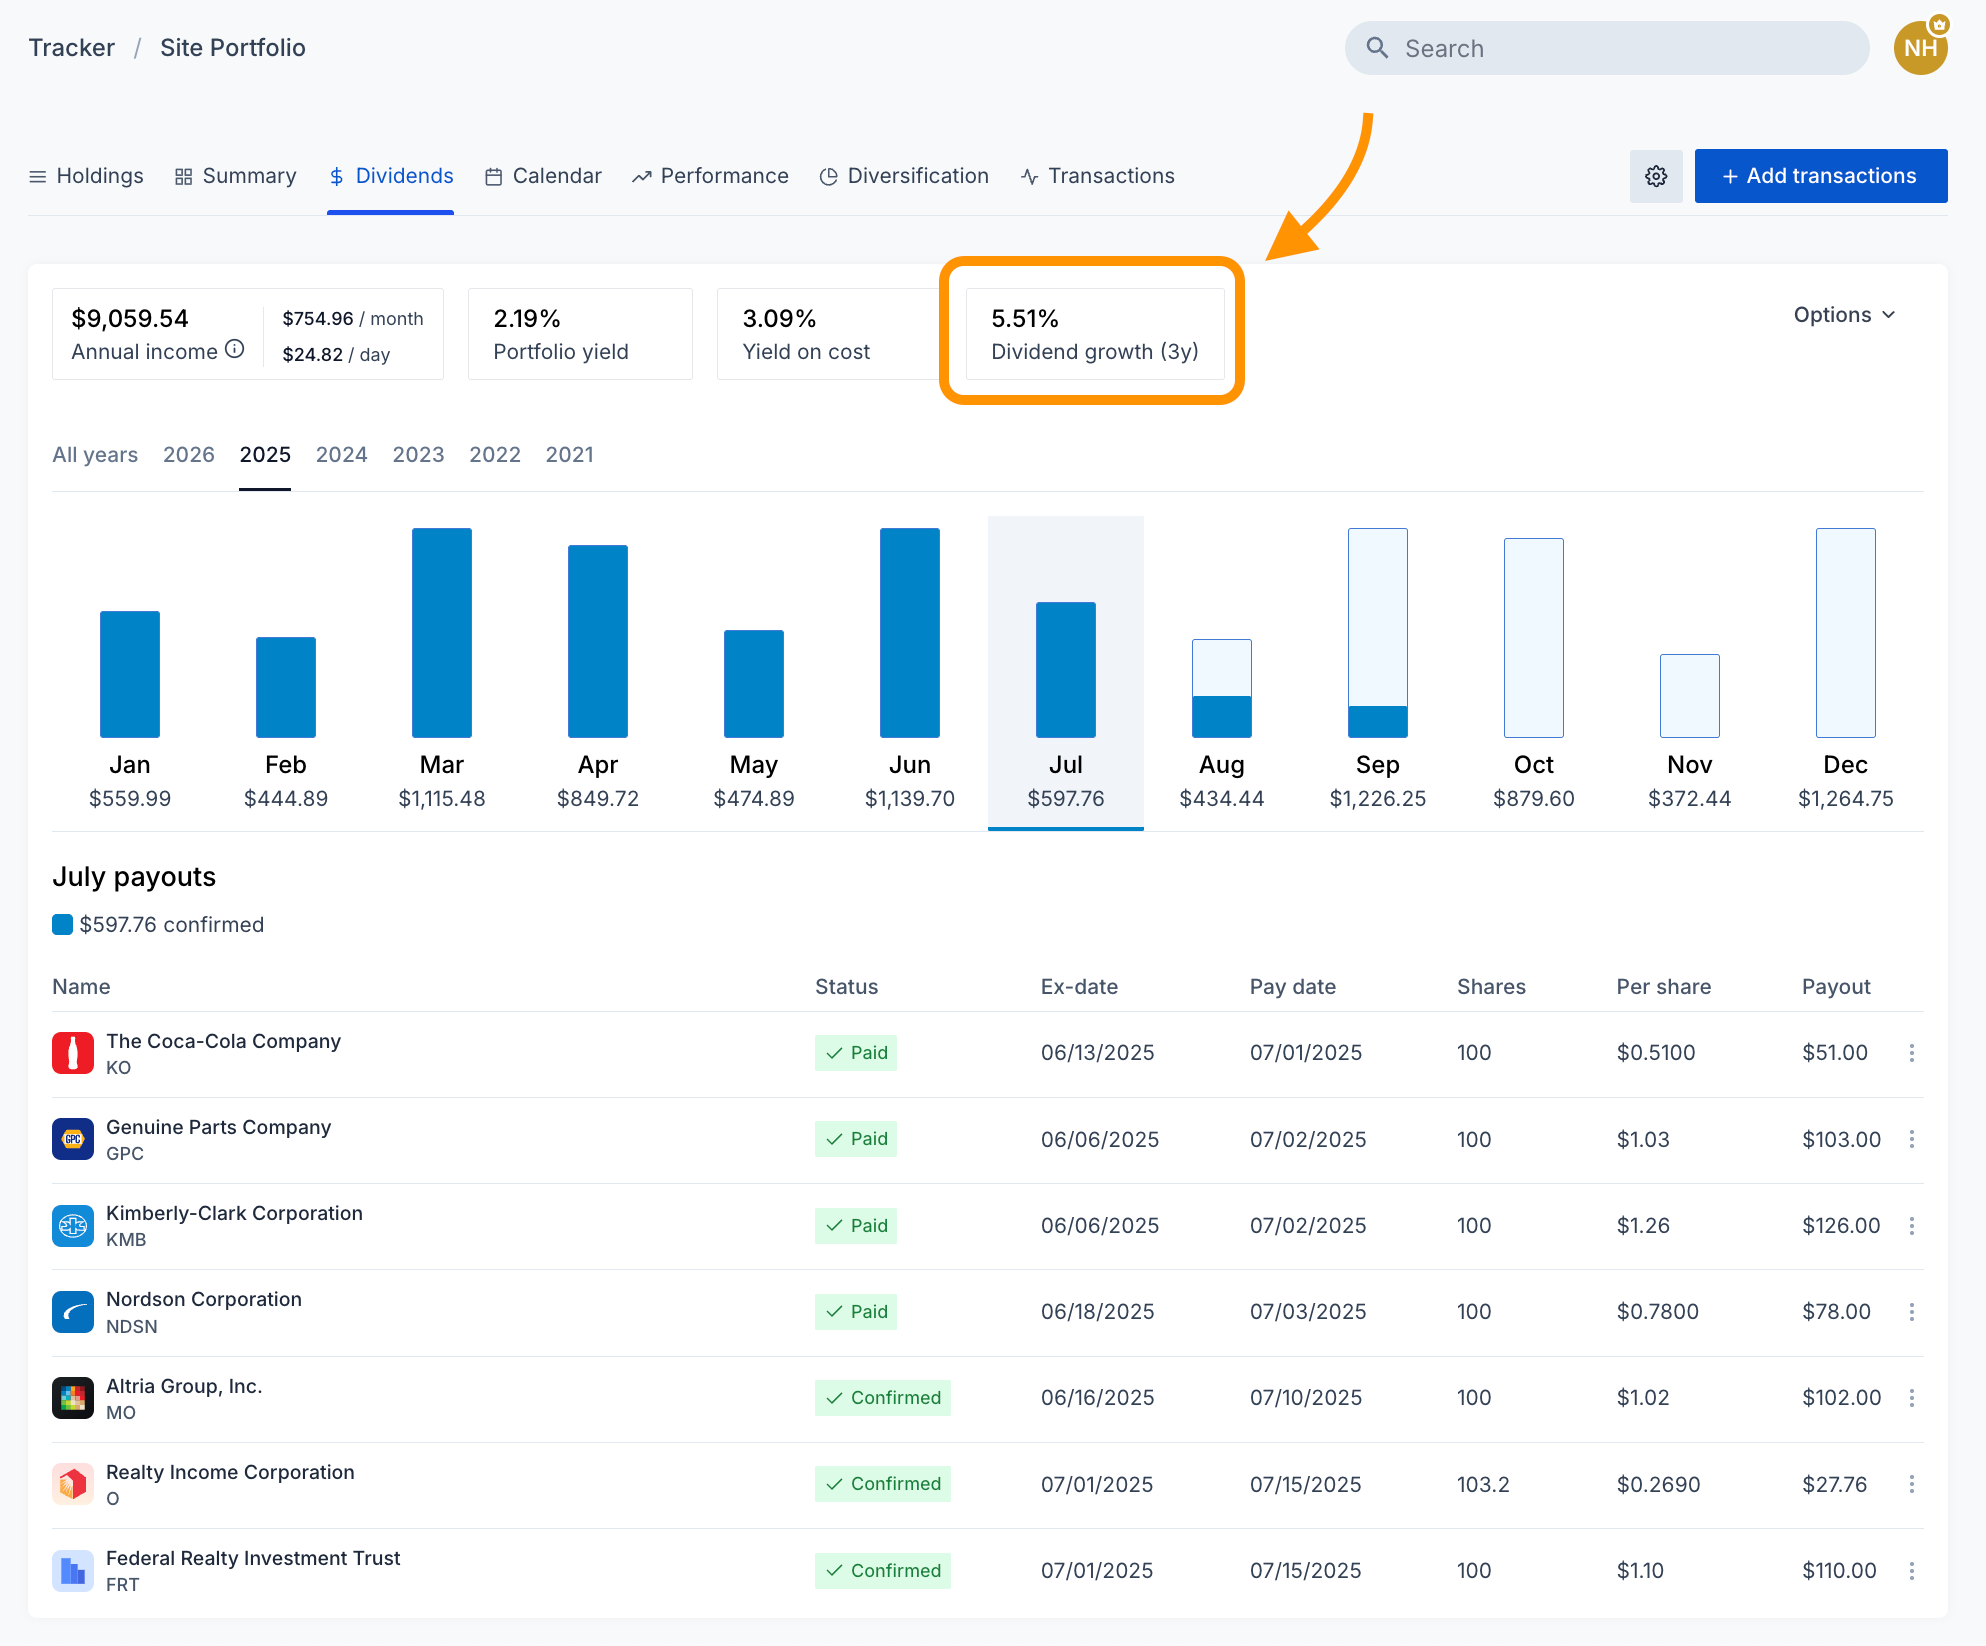
Dividend growth rates are automatically calculated for all of your portfolio holdings inside our tracker. Source: Dividend Watch
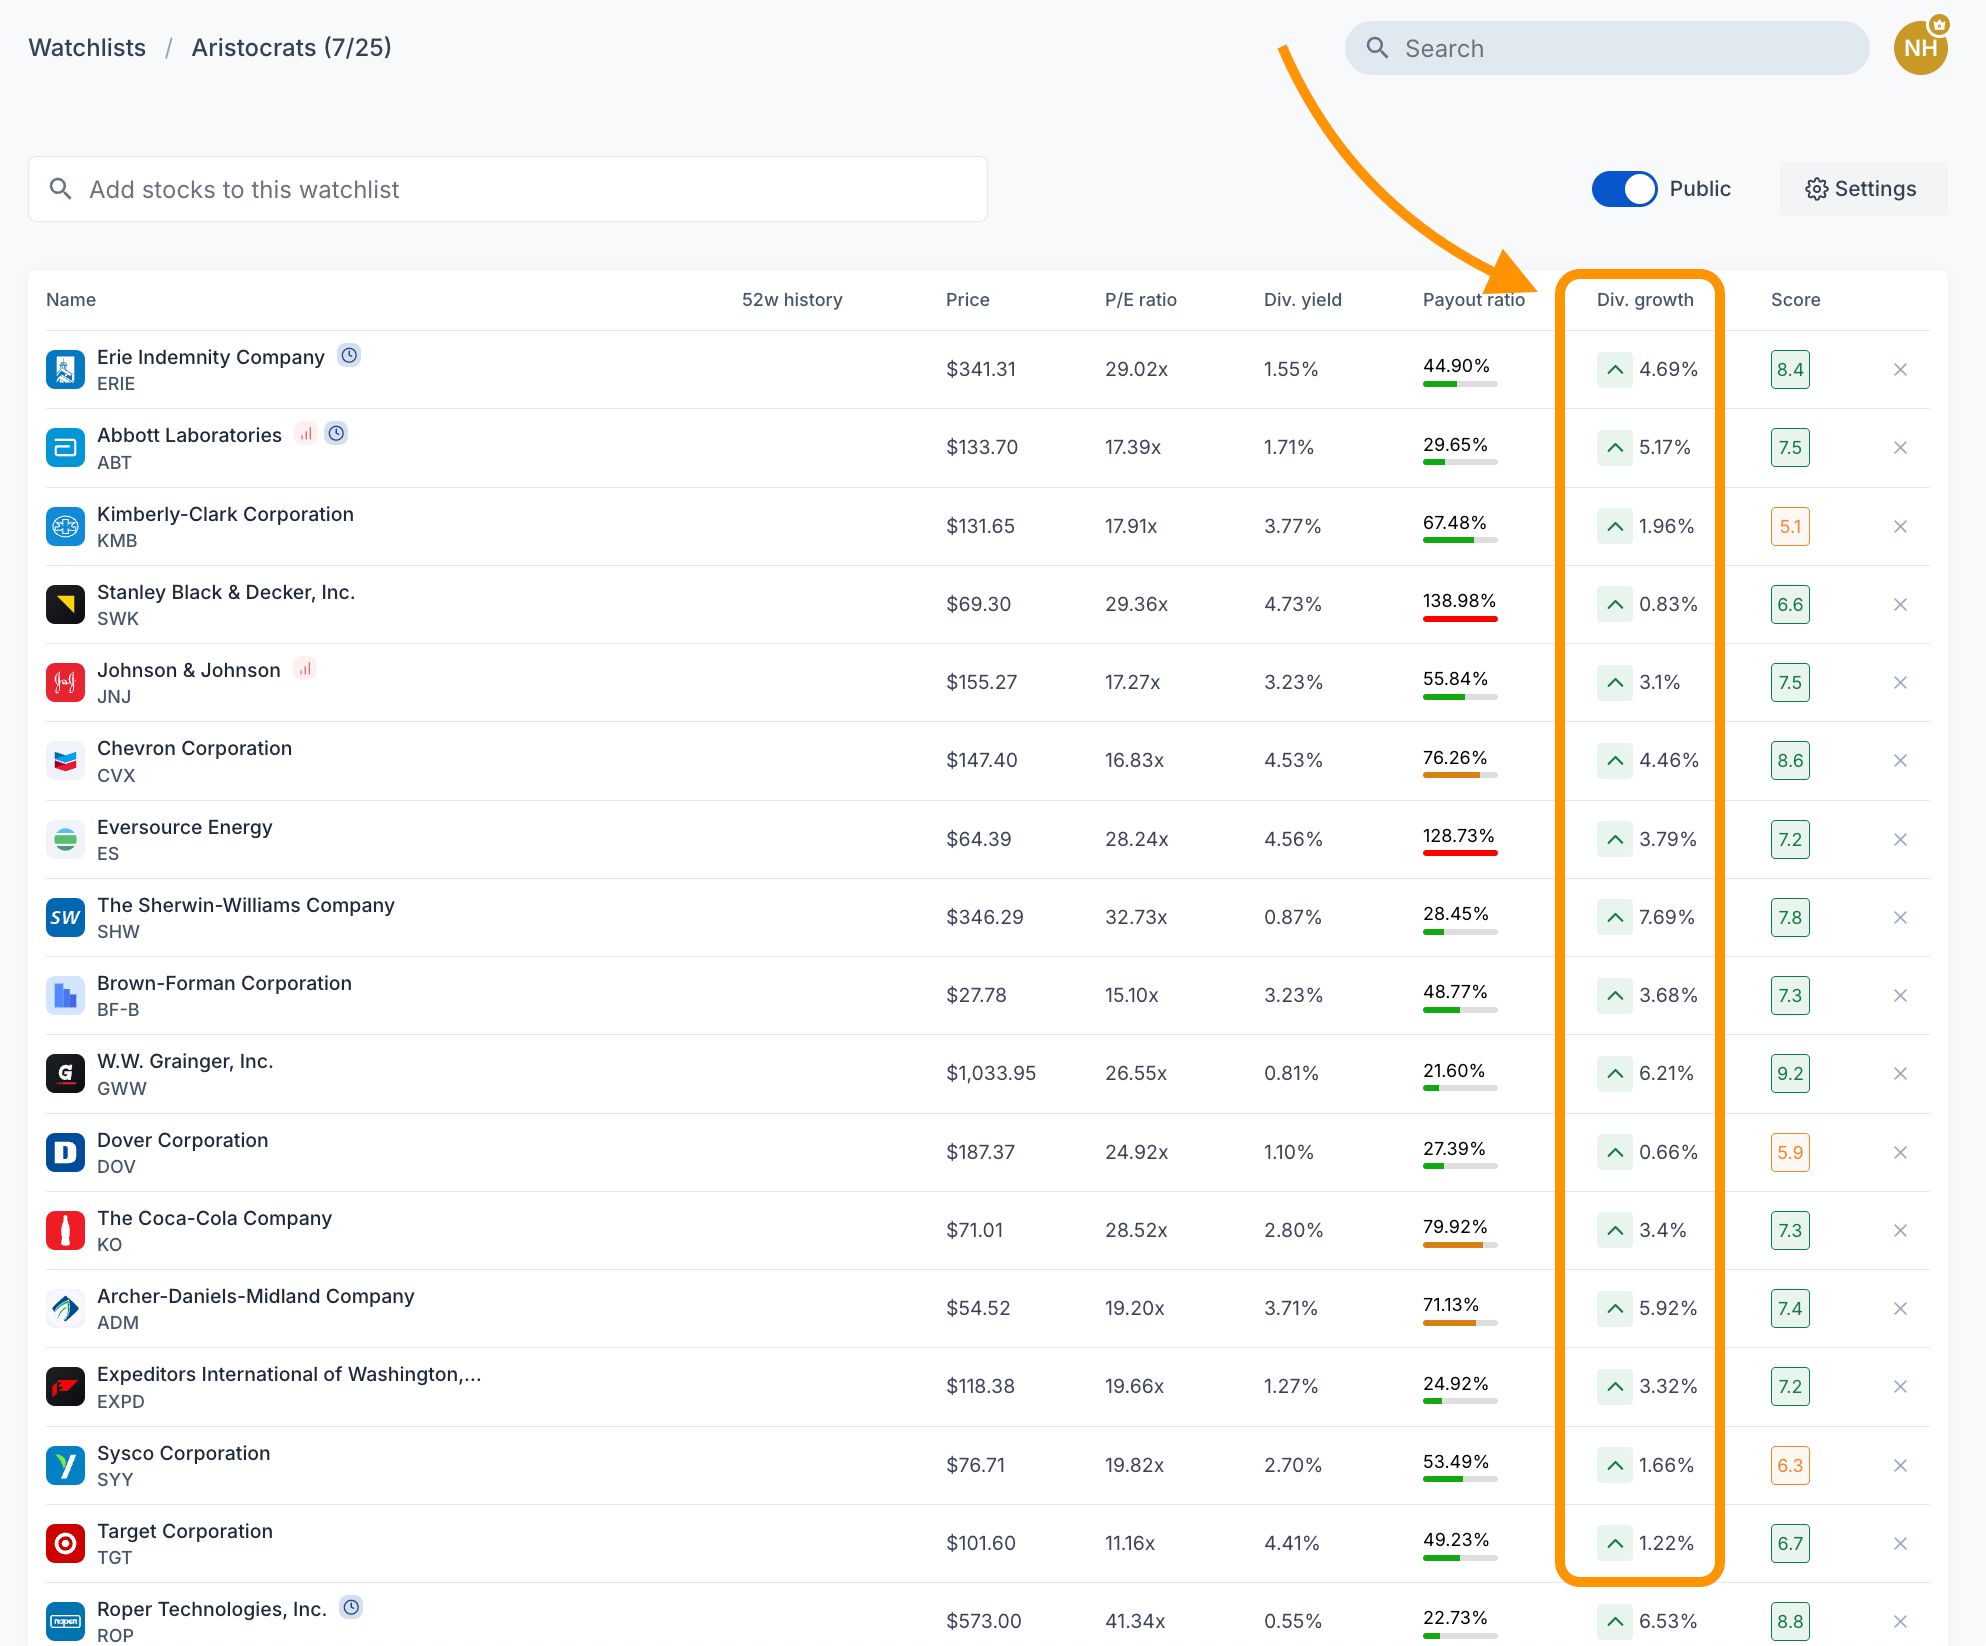
Dividend growth rates are one of the key dividends-focused metrics automatically calculated in your custom watchlist. Source: Dividend Watch
For manual calculation, there are two ways to calculate the ratio. The statement of cash flows displays actual dividend payments in the "Payments of dividends" line item under the financing activities section, which helps calculate the growth rate based on total dividends paid.
The income statement often includes a section for dividends per share, providing an alternative to total dividends paid, as shown on the statement of cash flows.
FAQ
What's a healthy dividend growth rate?
A healthy dividend growth rate generally ranges from 3% to 10% annually for established companies. Dividend aristocrats typically achieve long-term growth rates between 4% and 8%. Growth rates above 15% annually should warrant additional research into sustainability.


