Most advanced dividend calculator
As John Bogle always said: Dividends are investor best friend, or at least one of the closest ones.
Calculating dividend yields may sound simple at first, especially if you investing just a few dollars, but for long-term prediction or/and with a bigger portfolio some key aspects are hard to count with. There is market growth, dividend yield growth, re-investing paid dividends equally to your portfolio. Excel spreadsheet may not be the best solution for this anymore. Dividend portfolio calculator may come handy. By the way. It is free to use.
Select your stocks
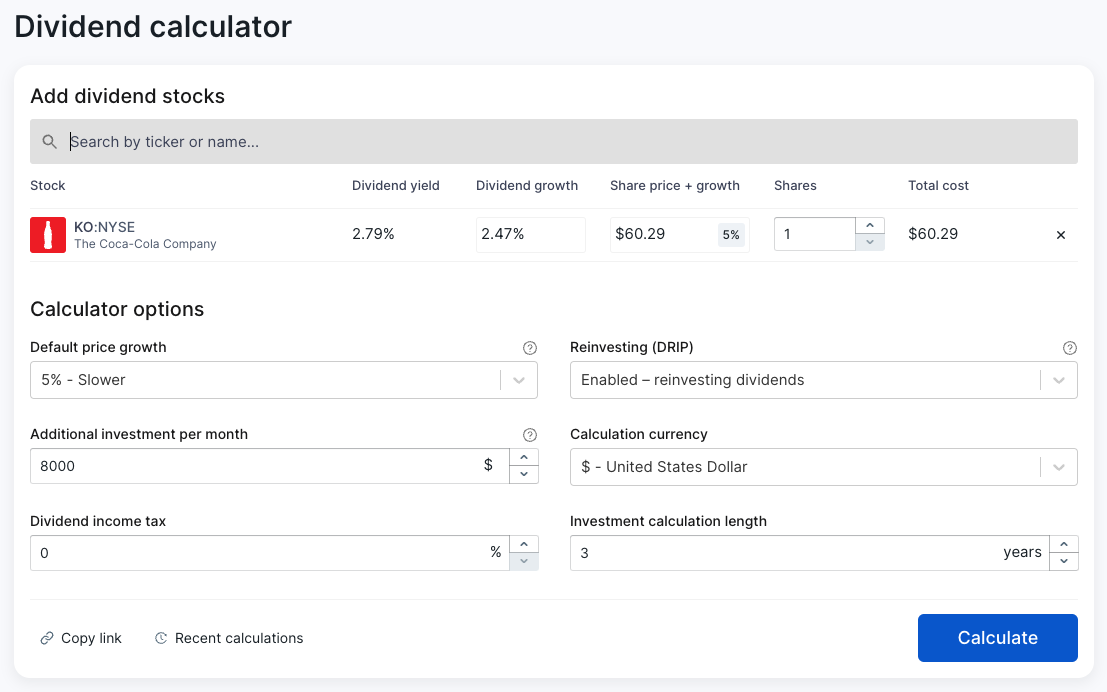
Most important things is to select equity in which you want to invest. You can add single stocks, ETF funds and bonds. There also lays most powerful feature of the dividend calculator. You just select specific titles and specific amount of stock you want to start with. So just select stocks and enter specific amount. We use this data to calculate next things.
Dividend investment strategy

There are 4 most important factors that have an impact on your strategy:
- Years of investing: Should to correspond to your time-frame. It means we will simulate portfolio for X years from today.
- Monthly investment: If you are a long-term investor, you probably putting some money in your portfolio every month. At least it is a good thing to do so. Put that amount there and we will include it to our math model.
- Dividend reinvesting: Determine if you want to reinvest dividends or not. This is important because of compound interest.
- Expected market growth: It can be positive or negative. It affects only stocks (single stocks or stocks inside ETF). Bonds are not affected so you can balance the risk and see that even if the market goes down few percent you can still be profitable because of dividends and bonds.
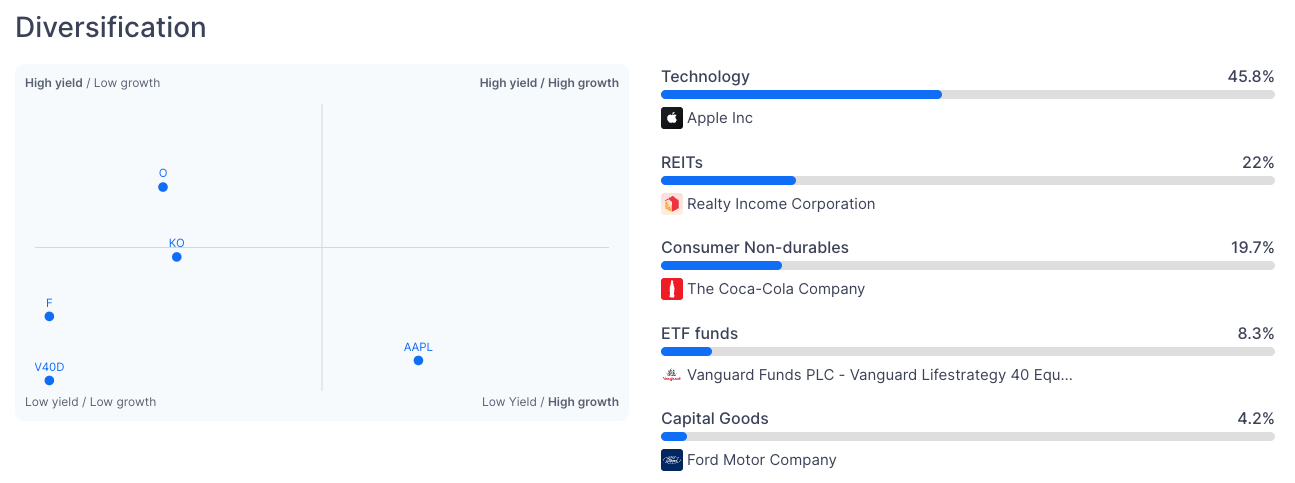
Under selected stocks you can see ratio between stocks and bonds. Many investors recommend bonds share to be around 20% - 60%. In famous Ray Dalio all-weather portfolio bonds occupying 40% share of portfolio.
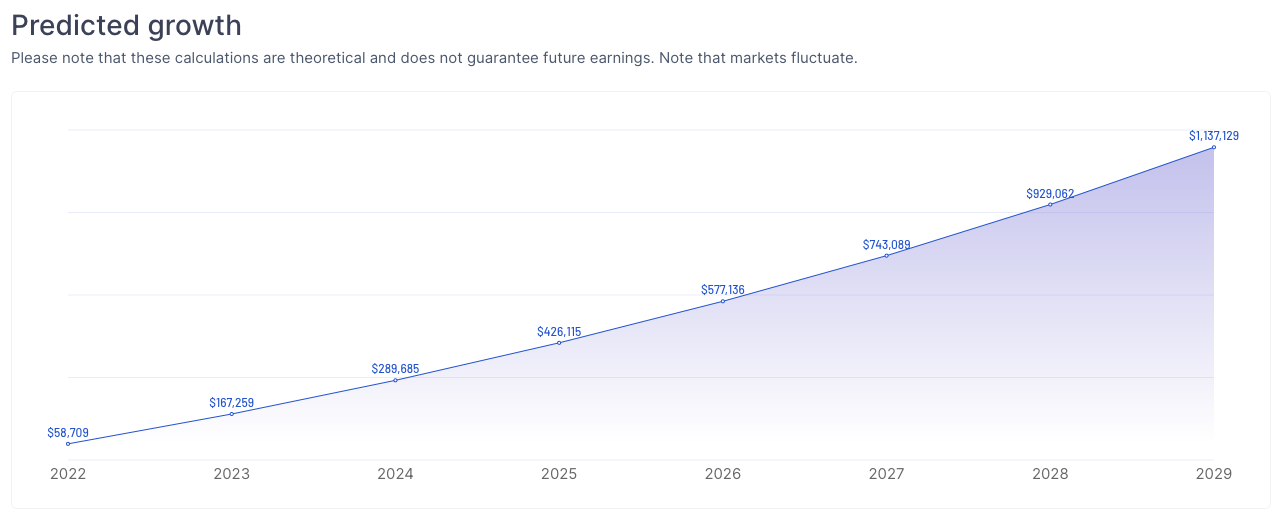
Results of calculator
We currently show three key metrics. Estimated portfolio highlights are derived from final state of your portfolio after years you specified. We also show development year by year, so if you are targeting some specific passive income with dividends you can get a time estimate.
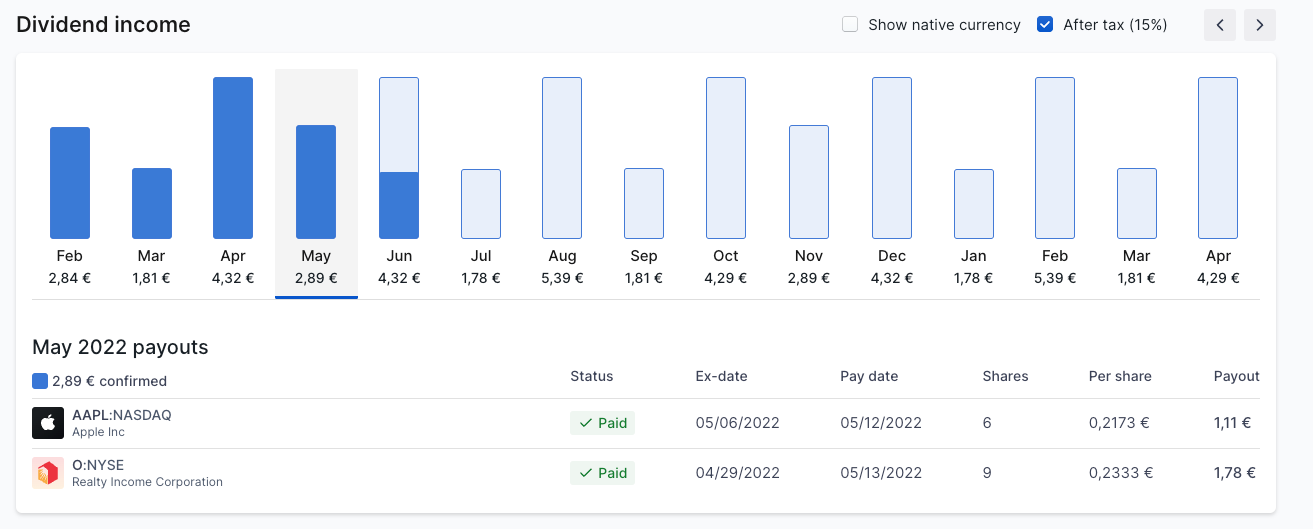
Third and popular view is a monthly dividend income chart. Based on company dividend history (some may have 25-50 years of dividend history) we can predict upcoming dates of dividends and show you amounts of money you get every month. Bonds, ETFs usually have a monthly payout of interest (paid in the forms of dividends). So they can provide a very stable stream of income.
Bottom line of dividend investing strategies
No one can predict the future. Investing always comes with risks. We consider dividends as one of most stable indicators. In accounting you can do magic with numbers. When comes to stock prices, market (especially in the US) is bloated by mood waves, screaming ads and a lot of noise. But it’s almost impossible to mess with dividends. You either have them or not.
This is the reason we selected dividends as main metrics for many of our tools. Our mission is to cut through the noise, to make an investing product without ads, bias and selling customer data (you are protected by strict European GDPR laws). To create tools that are simple and beautiful. To help beginner investors to make their first steps to financial freedom.
Check out our dividend calculator tool


